This note documents a falsification exercise. A cross-asset ranking signal survived a controlled development screen and looked promising on gross returns. Once historical spread, slippage and stress were introduced, the apparent economic edge largely disappeared.
Research setup
The study used a frozen multi-asset research protocol with M15 as the core decision timeframe and higher timeframes used only as causal context. The development OOS period ran from March through December 2024. Two later evaluation windows remained locked.
What looked promising before costs
The strongest Wave 1 discovery candidate was a 24-hour cross-asset ranking variant based on relative 48-bar returns. On the development OOS screen it produced:
The statistical picture was good enough to justify a harder execution test. It was not treated as a validated trading model.
Execution-cost stress
The next stage replayed the same frozen candidate under a single-global-slot execution model using historical spread information, then increased spread and slippage stress without retuning the signal.
| Scenario | Net diagnostic | Interpretation |
|---|---|---|
| Gross | +16.288% | Before market frictions |
| Spread 1× | +4.805% | Historical spread only |
| Base: spread 1× + slip25 | +1.004% | Positive, but marginal |
| Spread 1.5× + slip25 | −6.622% | Fails robustness |
| Spread 2× + slip50 | −21.819% | Strong failure |
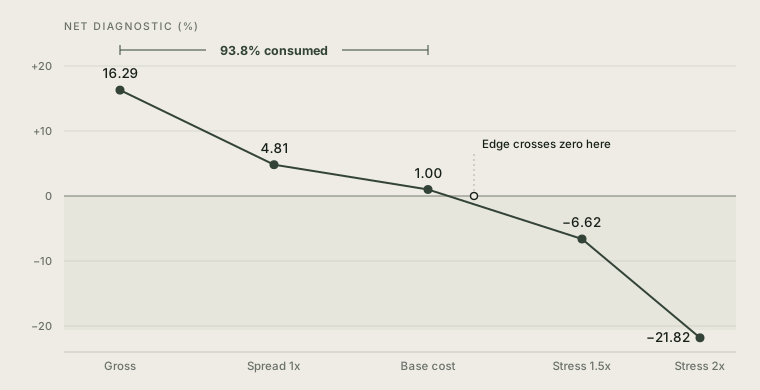
Where the edge went
A separate cost-attribution audit was run because the drop was large enough to raise the possibility of a cost-model error. The audit found no critical failure, no source-bar skips, exact Stage 03 / Stage 04 gross PnL parity, trade-count parity and monotonic degradation as friction increased.
The model was not rejected because its ranking signal was statistically meaningless. It was rejected because the magnitude of that signal was too small relative to the cost of expressing it.
The selected 24-hour candidate was evaluated as a multi-asset FX research signal. Its reported breadth metric in this screen was 8 of 10 eligible assets.
The negative result
Wave 1 produced four development survivors before execution costs. After the cost-robustness stage, the number of survivors was zero. The research decision was therefore to leave the gate unchanged and start a new cost-aware research wave rather than lower the robustness threshold.
Limitations
- The study uses a development OOS period, not the still-locked Selection OOS or Final Lockbox.
- Execution costs are modeled from the available historical spread field and stress assumptions; they are not a complete reconstruction of every broker fill.
- The result concerns this frozen candidate and research configuration; it does not establish that cross-asset ranking is generally non-executable.